The xaibenchmark library serves as a toolkit engineered for assessing the performance of Explainable AI models.
This toolkit comprises a variety of methods to calculate evaluation metrics including Intersection over Union (IoU), precision, recall, and the pointing game metric.
In addition, it incorporates a data loading functionality which allows for automatic loading of our proposed datasets,
thus streamlining both the process of model development and evaluation.
In this tutorial, we will first walk through how to use these evaluation methods, and what kinds of inputs they expect.
Then, we will introduce the data loading functionality of the xaibenchmark library.
We will also present our Human Annotation User Interfaces (UI) for annotating and evaluating explanations.
Installation
To install the xaibenchmark package, download xaibenchmark package from GitHub repository and install the package from the root directory using:
pip install -e .
The installation of the xaibenchmark package is hassle-free with minimum dependency on external packages.
Setting up the data
All the methods in the xaibenchmark library expect two inputs: an array of explanation maps (generated by an XAI model)
and an array of ground truth maps.
These should be numpy arrays, and their first dimension should be the same, representing the number of examples.
Here’s an example of how you might set up some synthetic data:
import numpy as np

num_samples, image_height, image_width = 16, 224, 224
maps = np.random.rand(num_samples, image_height, image_width)
gts = np.random.randint(0, 2, (num_samples, image_height, image_width))
In this example, maps is an array of random numbers between 0 and 1, and gts is an array of random integers 0 or 1, representing binary labels.
Computing metrics
Once you have your data, you can compute various metrics with the methods provided by xaibenchmark.
But first, you need to import the package:
import xaibenchmark
Intersection over Union (IoU)
The iou method computes the IoU metric for each pair of explanation map and ground truth map.
This is a measure of the overlap between the predicted and actual regions of interest.
Here’s how you can use it:
iou_value = xaibenchmark.iou(maps, gts)
print("IoU: ", iou_value)
Precision
The precision method computes the precision metric for each pair of maps and ground truth.
Precision is a measure of how many of the predicted regions of interest are actually correct.
Here’s how you can use it:
precision_value = xaibenchmark.precision(maps, gts)
print("Precision: ", precision_value)
Recall
The recall method computes the recall metric for each pair of maps and ground truth.
Recall is a measure of how many of the actual regions of interest were correctly identified.
Here’s how you can use it:
recall_value = xaibenchmark.recall(maps, gts)
print("Recall: ", recall_value)
Pointing Game
The hit method computes the pointing game metric for each pair of maps and ground truth.
The pointing game is a binary measure of whether the highest activated region in the explanation map overlaps with any ground truth region.
Here’s how you can use it:
pointing_game = xaibenchmark.hit(maps, gts)
print("Pointing Game: ", pointing_game)
With these tools, you can evaluate the performance of your visual XAI models.
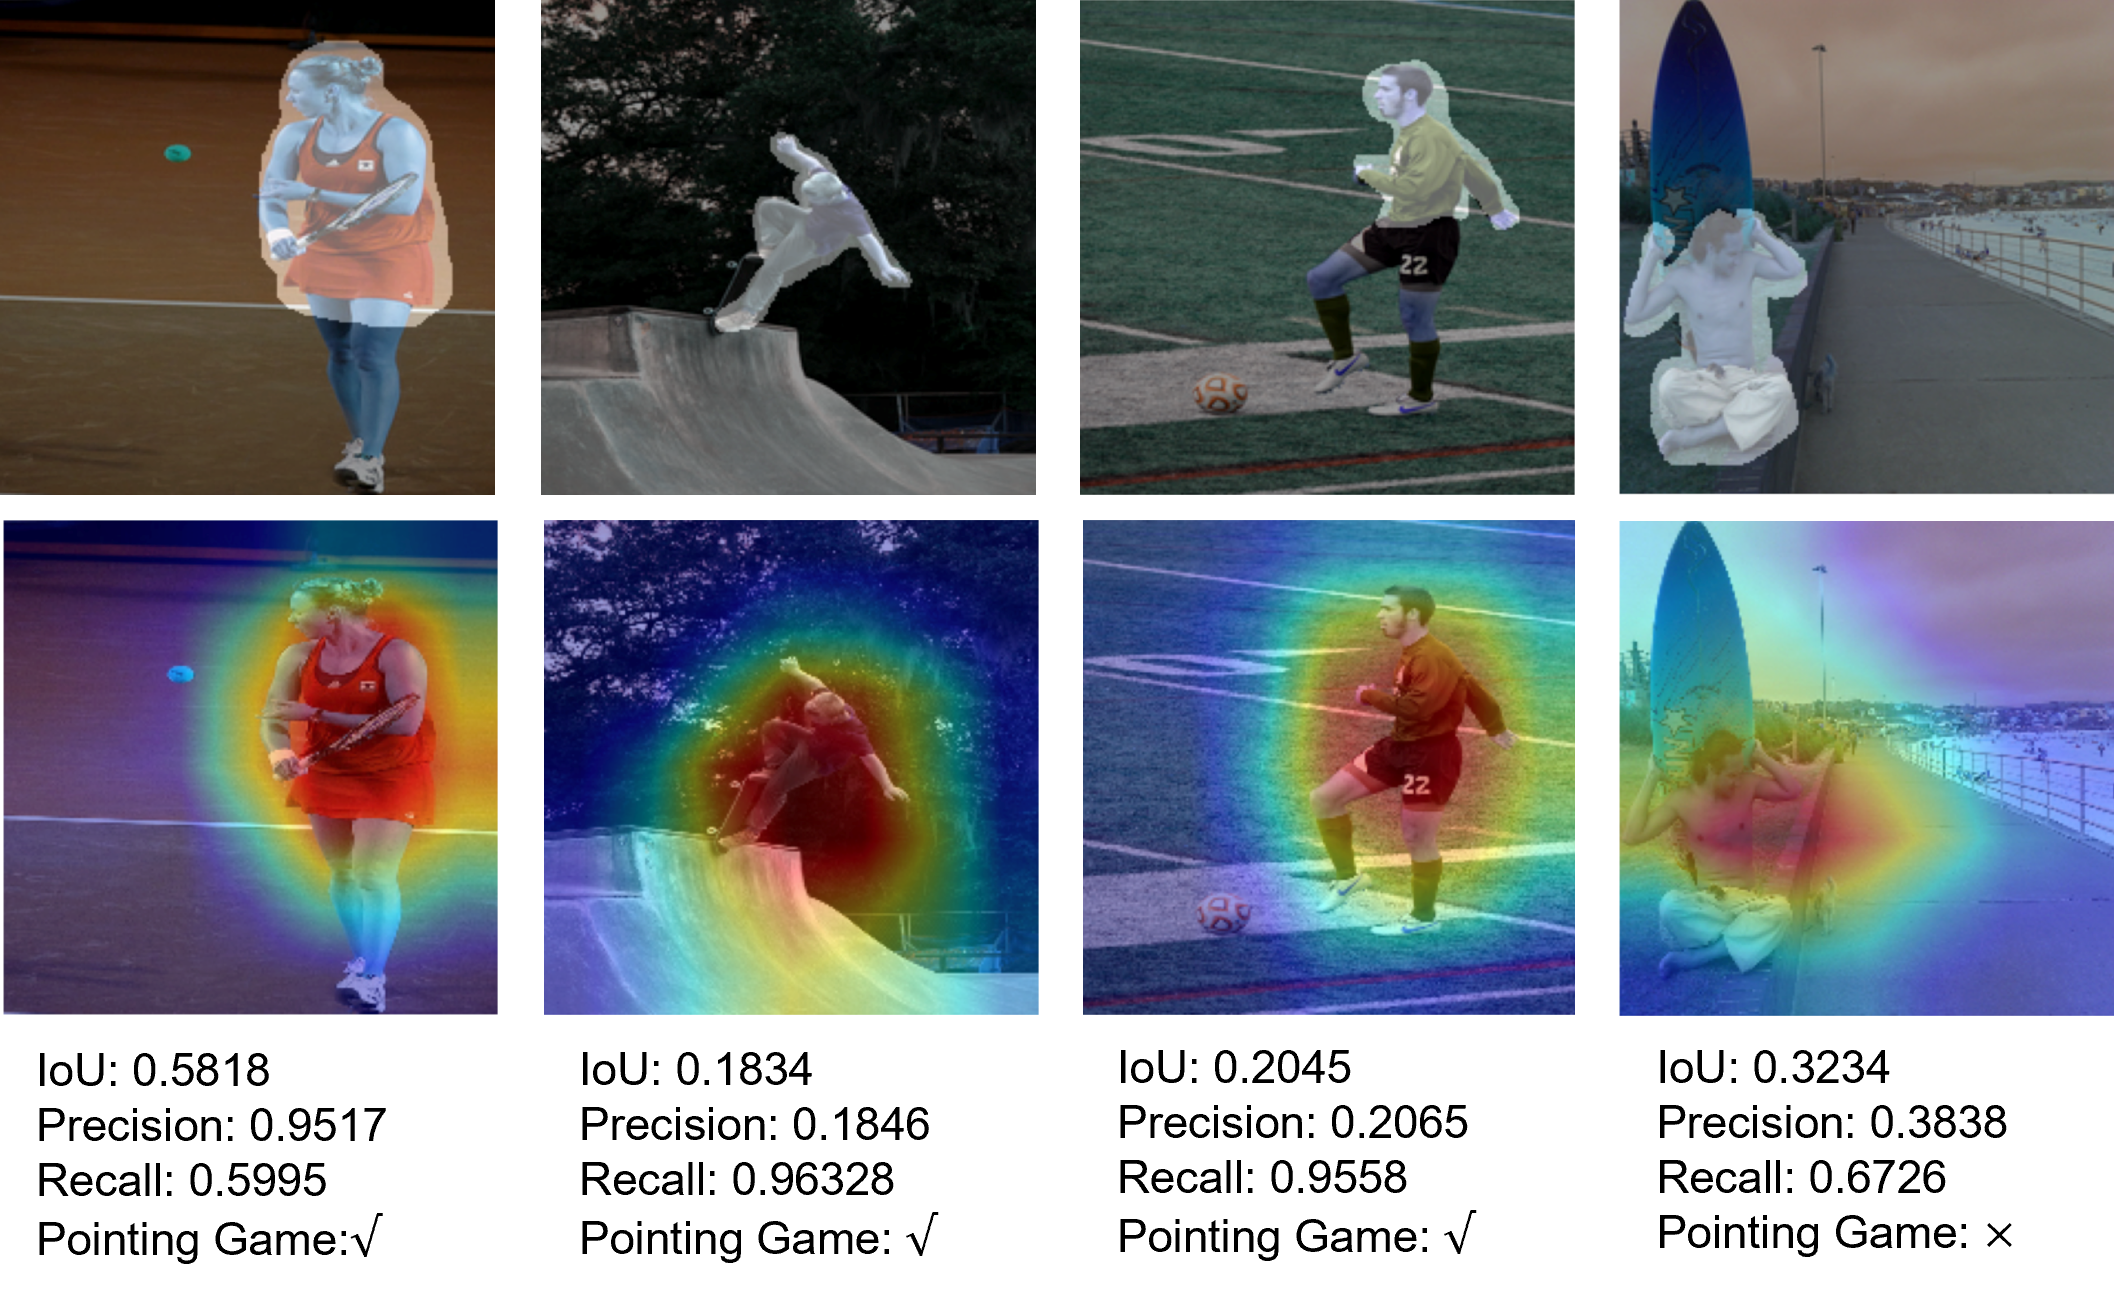 Examples of inputs and outputs of metrics computation
Data Loading
The xaibenchmark library provides an efficient way to load our proposed dataset using the loading function.
This function prepares your data in a way that’s suitable for training, validating, and testing Explainable AI models.
To use the loading function, please download the corresponding dataset on the dataset page and unzip it.
Here is how you can use loading:
import xaibenchmark

dataset = "pascal"
class_list = "aeroplane,bicycle,boat,bus"

train_dataloader, val_dataloader, test_dataloader = xaibenchmark.loading(dataset, class_list)
In this example, we are loading data from the Pascal VOC dataset, specifically the classes aeroplane, bicycle, boat, and bus.
The loading function returns three data loaders:
train_dataloader: This is the data loader for the training data. You will use this to train your XAI model.val_dataloader: This is the data loader for the validation data. You will use this to tune your model’s hyperparameters and to check for overfitting during the training process.test_dataloader: This is the data loader for the testing data. You will use this to evaluate your model’s performance once training is complete.
Each data loader is an iterable that yields batches of data. Each batch contains images, attention maps, and class IDs.
To check the shape of the data in each batch, you can do the following:
print("Show output size:")
for batch_id, (images, attentions, class_ids) in enumerate(train_dataloader):
    print(images.shape)
    print(attentions.shape)
    print(class_ids.shape)
    break
In this loop, we are iterating over train_dataloader and printing out the shape of the first batch of data it provides.
The images, attentions, and class_ids variables all contain a batch of data.
images: These are the input images for your XAI model. The shape will be(batch_size, channels, height, width).attentions: These are the ground truth attention maps. The shape will be(batch_size, height, width).class_ids: These are the class IDs for each image in the batch. The shape will be(batch_size,).
After printing out the shapes, we immediately break the loop as we just wanted to see the shape of one batch.
That’s it for the data loading functionality of xaibenchmark!
You’re now ready to use this library to load your data and evaluate your XAI models.
Download Package
Human Annotation User Interface (UI)
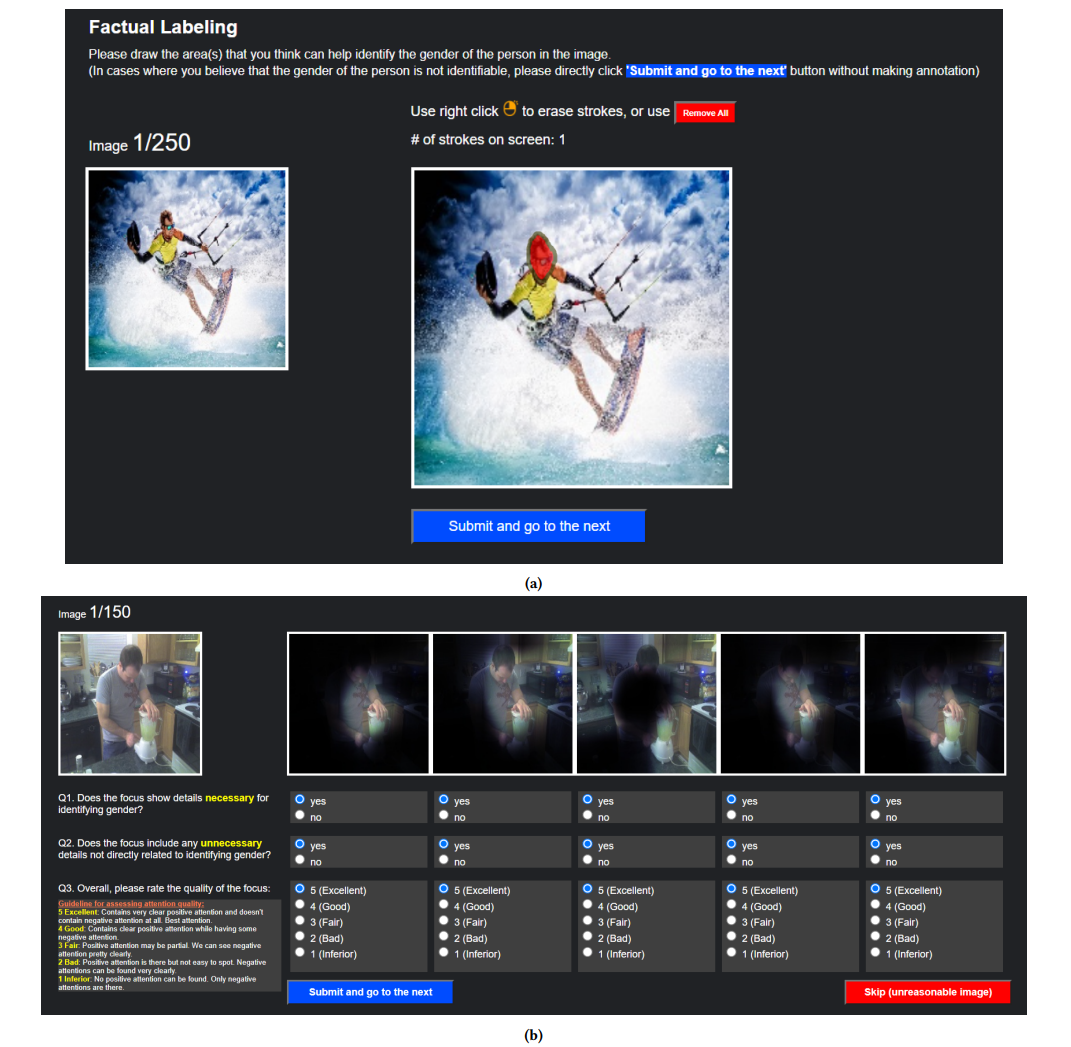
This is the two sets of UI for human annotation and evaluation.
(a) is the interface for attention annotation where users can draw on the image and generate a binary mask of the attention area used for improving model’s explanation quality.
(b) is the interface for models’ explanation qualities assessment where 5 model-generated explanations are displayed in random order and users will answer three questions for each explanation to evaluate its quality.